The question no dashboard answers
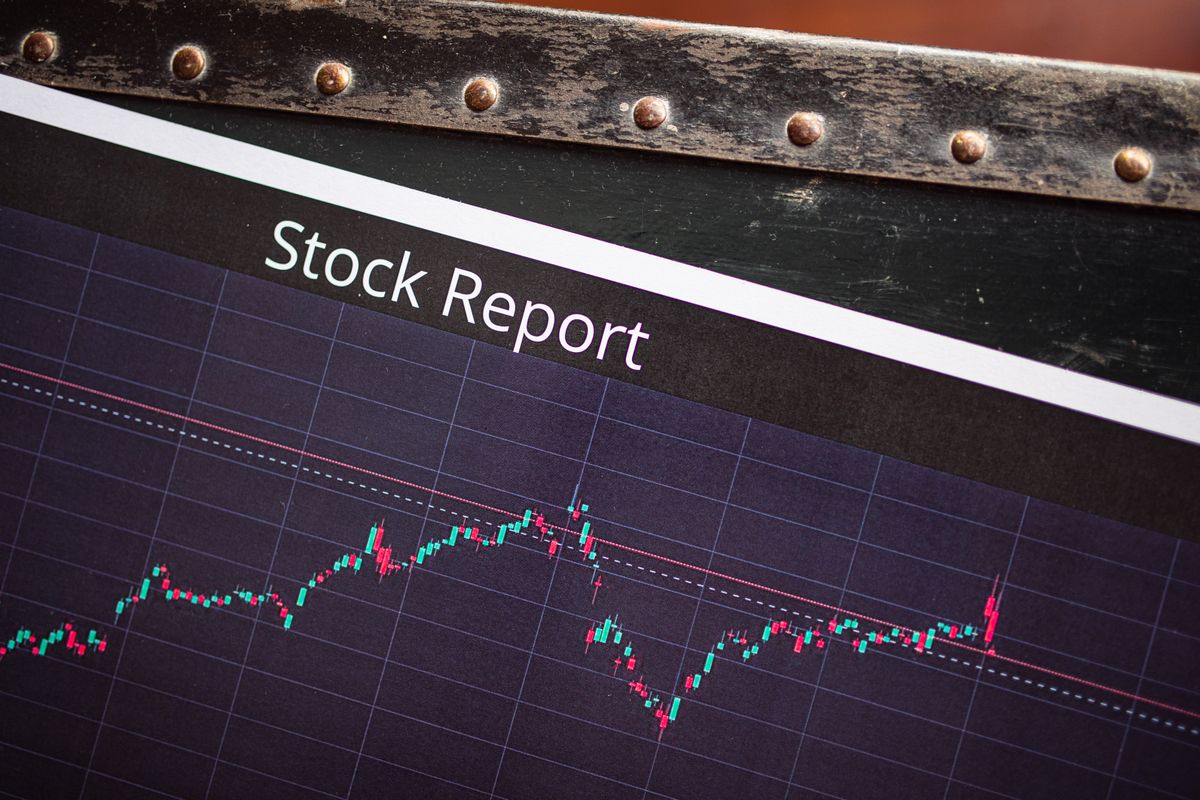
Every store owner has lived this morning: you open your analytics, revenue is down 18% from yesterday, and the dashboard shows you a red line going down. It tells you what happened with perfect clarity. It says nothing about why.
So you start the hunt. You check traffic. Then conversion rate. Then average order value. Then stock. Then whether a campaign paused. Then refunds. Then checkout errors. Then the payment provider. Then shipping. Twenty minutes later you have ten browser tabs and a hunch — not an answer.
Why dashboards can’t do this
Traditional BI tools — Looker, Power BI, Tableau, Metabase — are built to answer one question: “what happened?” They visualize. They do not explain. A line going down is a fact, not a cause. Correlating that drop against traffic, stock, device mix, campaigns, and deploys is exactly the cross-referencing work that gets dumped on a human every single morning.
What root-cause analysis actually looks like
The answer a store owner wants isn’t a chart. It’s a sentence:
Revenue dropped 18% yesterday because:
- Organic traffic fell 11% (a ranking drop on your top landing page)
- Product X went out of stock at 2pm — your #2 seller
- Conversion on mobile Safari dropped 8% after yesterday’s deploy
- Checkout errors rose sharply for one payment provider
That’s the difference between visualizing a problem and explaining it. One costs you twenty minutes of tab-hopping; the other hands you the four things to go fix.
How datavessel closes the gap
datavessel connects to the sources that actually hold the answer — GA4, Google & Meta Ads, your Shopify / Shopware / WooCommerce store, orders, inventory — and lets you ask the question in plain language instead of assembling the answer by hand:
- “Revenue dropped yesterday. What changed versus the day before?”
- “Break the drop down by traffic, conversion, AOV, and stock.”
- “Did any product go out of stock or any checkout error spike?”
Because it reads across every source at once, it correlates the drop for you instead of making you correlate it in your head. And because it’s agent-friendly, you can schedule it: a morning brief that lands in Slack before you’ve noticed the dip, already explaining it.
The takeaway
The biggest gap in ecommerce analytics isn’t more data — it’s the leap from “what happened” to “why.” Dashboards stop at the red line. The next question — why is it red? — is the one that actually costs you money to answer slowly. Make your data answer it directly.
Want yesterday’s revenue explained instead of just charted? Connect your store to datavessel and ask why.
Leave a Reply